
Renewable sources provided record 30% of electricity last year
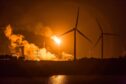
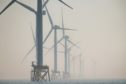
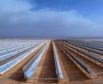
The share of global electricity from renewables rose to a record 30% last year as the growth of wind and solar power continued to far exceed that of fossil fuels.
The share of global electricity from renewables rose to a record 30% last year as the growth of wind and solar power continued to far exceed that of fossil fuels.

The UK government has awarded a £196 million grant to build the first next generation nuclear fuel facility in Europe in a bid to further isolate Russia from global energy markets.
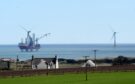
Vattenfall’s recent announcement that it was canning its hydrogen trial at the European Offshore Wind Deployment Centre offshore Aberdeen has rather riled me.

To achieve a just transition workers in traditional energy sectors such as oil and gas must see a pathway to greener employment.

Norway has yet again demonstrated that it really is a maritime technology leader with ferry company Torghatten Nord placing an order in-country for the construction of the largest hydrogen-fuel cell ships attempted anywhere.

Siemens Energy AG (FWB:ENR) shares jumped 14% after the company signaled its lucrative gas and electric grid businesses were no longer burdened by ongoing losses at its struggling wind-turbine unit.

Energy data firm Wood Mackenzie has announced the appointment of a new CEO as his predecessor moves on to "pursue other opportunities".
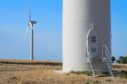
The Health and Safety Executive (HSE) has issued a notice to offshore and onshore wind developers after a turbine technician was injured by a service lift.
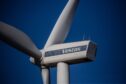
Henrik Andersen is no stranger to crisis. A decade ago turbine maker Vestas Wind Systems A/S (CPH:VWS) was in trouble when governments pulled back subsidies for renewable power.
The High Court has ruled the UK government's climate action plan is unlawful for the second time in a case brought by environmental groups.

Increases in water demand for the energy transition are set to run in parallel with climate change-induced alterations to water supplies, with possibly severe implications for the viability of different energy transition sources.

Humankind is at a critical juncture; arguably even the watershed of its existence. If we don’t claw back and rectify the damage to the lump of rock that is our forever home then we will pay the ultimate price.
The pipeline of battery storage projects in the UK has grown by two-thirds in capacity over the past year, trade association RenewableUK has found.

The approval of the Green Volt floating offshore wind farm has raised concerns regarding the lack of a Scottish state energy company, with the Japanese and Italian governments set to benefit through stakes in its developer Flotation Energy.
The North Sea Transition Authority (NSTA) has introduced a new clause for oil and gas licences which overlap with offshore wind leases.
Fresh research has said that recent increases in the cost of offshore wind farms are mostly expected to be short term.

Flotation's 50-strong Granite City team has joined a cluster of energy and renewables businesses in the city centre office complex.

Shell (LON: SHEL) beat analyst forecasts with earnings of $7.7bn in Q1, as the top financial boss asks shareholder support for the oil giant's reduced climate targets.

With growing geopolitical unrest, and headwinds in renewables, future energy policy should recognise the vital role that oil and gas will continue to play, writes Jon Fitzpatrick, founder and managing director of Gneiss Energy.
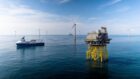
Macquarie Asset Management announced it has signed a deal to divest a 10% stake in the East Anglia ONE offshore wind farm.

Well-Safe currently runs three rigs - but Christopher Hay will be looking to "try and double that within the next five years".

A new opportunity has been opened to bring emissions-busting Carbon Capture and Storage (CCS) technology to the English Channel.

Lord Fairley accepts case for judicial review into development plans for much-loved Aberdeen green space.
GE Vernova (NYSE:GEV) has invested $10.2 million (£8.1mn) in Xlinks First’s proposed UK-Morocco power project.
Chinese turbine manufacturer Mingyang Smart Energy (LON:MYSE) has said that the company is actively exploring international markets despite a fall in its overseas revenue.