
D2Zero announces new leadership team
Decarbonisation and energy solutions firm D2Zero has announced new senior leadership and board appointments as it expands its leadership team.
Decarbonisation and energy solutions firm D2Zero has announced new senior leadership and board appointments as it expands its leadership team.

The Scottish Government has said it will work with SSE Renewables to progress its major 4.1GW Berwick Bank offshore wind farm after it missed a crucial deadline due to slow consenting.
The UK risks wasting its "naturally advantageous position" on CO2 transport, according to one analyst.

Energy services group Kent will provide pre-front end engineering design (pre-FEED) assessment of the proposed Spiorad na Mara offshore wind farm.

The new Moray West offshore wind farm has had its first turbine installed.

'Britain Talks Climate' survey also finds majority of Brits favour a ban on new North Sea oil and gas licences.

Aberdeen has a "great opportunity" with Green Volt, says Flotation GM Barry MacLeod.
One of the world’s biggest wind turbine makers wants to hold onto recent price gains — rather than pass on savings — as it bids to bolster earnings.
Denmark has kicked off its largest-ever wind power tender that will more than triple its offshore capacity by the end of the decade.

Aberdeen-headquartered OEG Renewables has landed a multi-year deal with Ørsted covering its offshore wind projects in the north-eastern US.
SSE Renewables’ Berwick Bank wind farm, which is set to create "nearly 5,000 jobs", has not received Scottish government approval ahead of the CfD deadline.
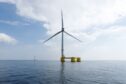
Green Volt, one of the world’s largest floating windfarms, has been approved off the Aberdeenshire coast, in what will be a jobs boost for the region.
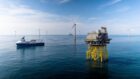
Perenco has outlined its plans for two new UK carbon capture and storage (CCS) projects, Poseidon and Orion.

"World class climate emergency leadership requires more than good intentions and setting ambitious goals."
AR7 would need to procure 19GW to deliver 50GW of offshore wind by 2030, which puts this aspiration increasingly out of reach.
Synergia Energy (AIM: SYN) aims to drill an appraisal well at the Camelot field, forming part of its UK Medway Hub Carbon Capture and Storage (CCS) plan, in the next 18-24 months.

National Grid has officially launched its record-breaking Viking Link interconnector cable between the UK and Denmark, in what it says is the "next step towards a North Sea super-grid".
Equinor (OSE:EQNR) has received development consents for its plans to extend the operational Sheringham Shoal and Dudgeon offshore wind farms off the North Norfolk coast.
Alexander Quayle, project director, Flotation Energy and Chris Hill, UK managing director, Vårgrønn spoke about the current opportunity for UK offshore wind jobs.

The Scottish government is to abandon its ambitious climate target of reducing greenhouse gas emissions by 75% by 2030.
Chevron Corp.’s (NYSE:CVX) venture arm launched a fund — its third — with a $500 million commitment to invest in clean energy technologies.

Offshore wind sector 'Industrial Growth Plan' could support 10,000 jobs a year and provide a £25bn boost to the UK economy by 2035.

Carbon capture and storage (CCS) firm Storegga has named Tim Stedman as its new CEO.

As the UK pushes forward with its energy transition ambitions OEG Renewables wants to see domestic "Tier One" contractors in green energy.

Agreement covering the design and manufacture of floating offshore wind substructures heralded as a "vote of confidence" in Scotland