
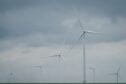
Offshore wind sector targets five tech areas to triple UK supply chain manufacturing
Offshore wind sector 'Industrial Growth Plan' could support 10,000 jobs a year and provide a £25bn boost to the UK economy by 2035.
Offshore wind sector 'Industrial Growth Plan' could support 10,000 jobs a year and provide a £25bn boost to the UK economy by 2035.

Carbon capture and storage (CCS) firm Storegga has named Tim Stedman as its new CEO.

As the UK pushes forward with its energy transition ambitions OEG Renewables wants to see domestic "Tier One" contractors in green energy.

Agreement covering the design and manufacture of floating offshore wind substructures heralded as a "vote of confidence" in Scotland

Four SNP MPs have called on the UK government to explain the confusion over the number of energy civil servants headed for Aberdeen.

Fabrication giant Harland & Wolff (H&W) expects to create at least 200 new jobs at Arnish, on Lewis, and 400 in Fife through a £270 million investment in its the Scottish shipyards.

BP has cut more than a tenth of its workforce from its electric vehicle charging business, BP Pulse, and pulled out of several markets, it has been reported.

Trevor Smith and his wife Dawn were shocked to discover the future plans after receiving two letters through their door.

Australian Prime Minister Anthony Albanese plans an Inflation Reduction Act-style program to stimulate green manufacturing industries and drive his nation’s economy beyond its traditional minerals extraction base while bolstering economic security.

Roz Foyer, general secretary of the STUC, said there was “deep concern” among workers about the future of the industry.

Offshore wind developer Ocean Winds has found a new CEO in former Voltalia boss Craig Windram.

Reports last year heralded 200 roles being relocated to the Granite City, but the actual figure appears to be far lower.

First-of-its kind case leads to landmark climate ruling, which is likely to have ramifications across Europe.
The European Union ramped up pressure on Chinese clean-tech investments potentially squeezing out its local suppliers amid EU efforts to transform the bloc into a green economy.

UK gas infrastructure manager px Group has acquired a majority stake in German hydrogen firm LIFTE H2.

As a leader in high-efficiency electric motors, ABB IEC Low Voltage (LV) Motors offers reliable energy-efficient motors for various industries including metals, chemicals, cement and mining, food and beverage.

Instead of flaring, oil and gas producers could transform the methane emissions into organic fertilizer.

A former highlands RAF and Royal Navy base is set to be repurposed for renewables under the Inverness and Cromarty Firth green freeport as tax incentives roll in.

More than two thirds of university energy degrees worldwide remain focused on the fossil fuel industry rather than renewables, according to a new study.

Diversification – in terms of energy sources, innovation and resource – is the vital component to creating a thriving energy sector in Scotland.

The UK’s wholesale power prices will drop below zero for 12 hours on Saturday — the second-longest such stint on record — as strong renewable generation means supply will outstrip demand.

Vargronn will appoint former Equinor renewables boss and Aker Solutions executive vice president Stephen Bull as CEO.

Over the next ten years, the Global Wind Energy Council predicts that more than 380GW of offshore wind capacity will be added across 32 markets.

Scotland’s National Energy Skills Accelerator (NESA) is on track to support over 700 individuals access fully funded places on energy transition focused courses during 2023/24.

New research has warned that growing uncertainty, driven by rising commodity prices and conflicts, risks undermining the global energy transition.